


What is GA4?
GA4 (Google Analytics 4) is the latest Google Analytics version set to fully replace GA3 in July 2023. Back in 2005, Google launched Google Analytics to help website owners collect, measure, and analyze website data with the aim of improving their sites. GA4 is the latest of four generations of Google Analytics.
When compared to previous versions like Google Analytics 3 (GA3 or Universal Analytics), GA4 offers a wider data scope (collects both website and app data), offers better user privacy for the future, and predictive insights (powered by AI & machine learning). For instance, GA4 can integrate with your Google Ads account to offer great search user behavior insights that improve your ad ROI (return on investment).
What is Google Data Studio?
In simple terms, Google Data Studio (currently known as Google Looker Studio) can be described as a tool/software that helps to better present Google Analytics data.
Google Analytics collects a lot of data, which can cause an information overload. Trying to make sense of Google Analytics data in the past usually involved downloading data into Excel spreadsheets and manually preparing graphs, diagrams, and charts (i.e., bar charts, pie charts, bullet charts, etc.) This is where Google Data Studio comes in.
Google Looker Studio was initially released in 2016. The data visualization tool/software turns complex Google Analytics data into simple reports that are easy to understand. Most importantly, the reports look professional and feature visuals. This tool is one of the best ways to make sense of Google Analytics data, whether that be for marketers in charge of their client’s data or for business owners who are trying to do it on their own. On top of that, Google Looker Studio can be connected to many different data sources, including GA4.
Should you connect GA4 and Data Studio?
Yes! Here at Nomadic Advertising, we know the many benefits that come with connecting GA4 and Google Data Studio and how it helps us have a better understanding of Google Analytics data. The different features of Google Looker Studio make it one of the best tools to help turn large amounts of seemingly complex data into a report that is easy to understand, why wouldn’t you want that for your business?
Data Studio offers the following main benefits:
Benefits of connecting GA4 and Google Looker Studio
- Superior data representation: Data Studio allows you to automatically create graphics, charts, and tables out of your Google Analytics data. You can also change the font and colors in your report as well as add a video/s to your final report.
- Import third-party data: You can import data from other places besides Google Analytics. For instance, you can get data from Facebook Ads, LinkedIn Ads, and other sources and create Ad reports that look professional and are easy to understand.
- Automatically updated reports: Once you connect GA4 to Data Studio, any new analytics data is automatically updated on all reports referencing that source. This eliminates manual and tedious report updates in the future.
- Shareable reports: Connecting GA4 to Data Studio also enables you to decide the data you want to share and who can access it or make changes to your report. Google Looker Studio utilizes the same features as Google Sheets and Google Docs. Marketers can simply share reports with clients and other team members after assigning the necessary viewer or edit-level access.
- Branded reports: Connecting also makes it possible to brand reports with a logo. This benefit stands out for marketers who want to present professional Google Analytics reports that include a client’s logo.
A step-by-step guide on how to connect Google Analytics 4 and Data Studio
If you want to enjoy all of these GA4 data studio analytics pros, we suggest you go ahead and connect your GA4 account to Google Data Studio (Google Looker Studio). But how do you get started? Below is our handy step-by-step guide to give you a hand.
Step 1: Log in to Data Studio
Go to the Data Studio website.
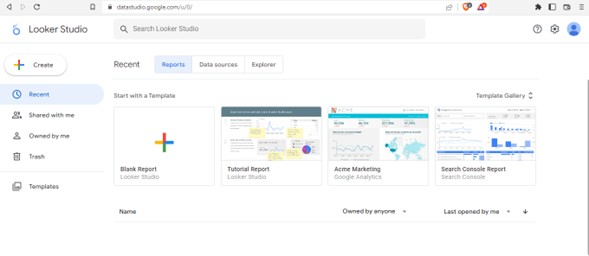
You’ll be prompted to log in using your Google Account. Choose the one connected to your Google Analytics 4 account. If you have already logged in to your Google/Gmail account, you’ll be redirected to the Data Studio page.
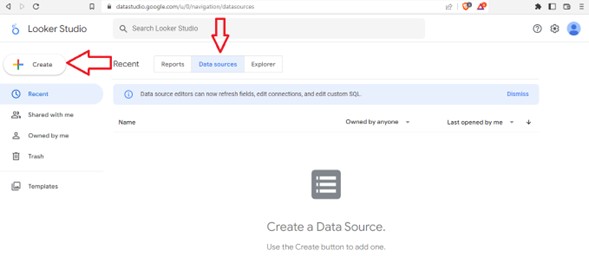
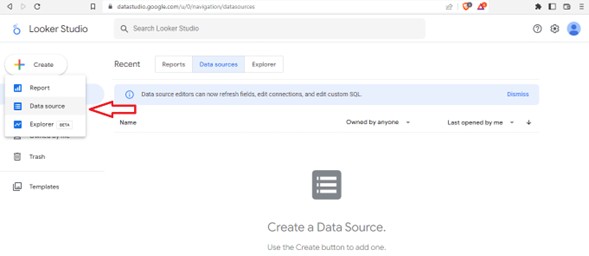
Step 2: Create a data source with GA4
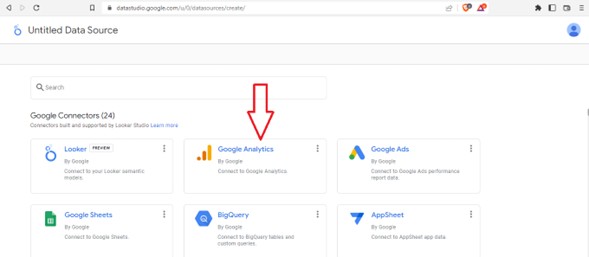
Click the “Data sources” tab and click on “Create”.
Step 3: Select Google Analytics
You can connect to other data sources to enjoy even more possibilities, such as linking Google Data Studio to Google Ads.
Step 4: Authorize Looker Studio to connect to your Google Analytics A/C
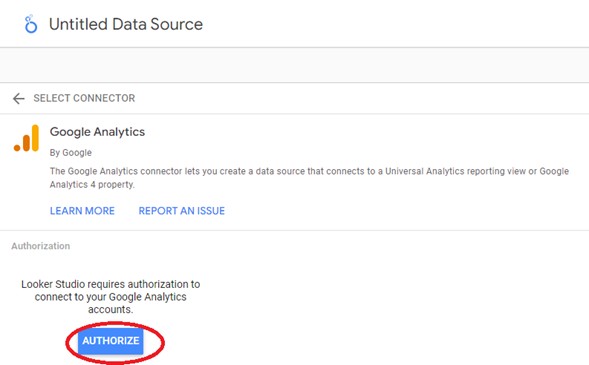
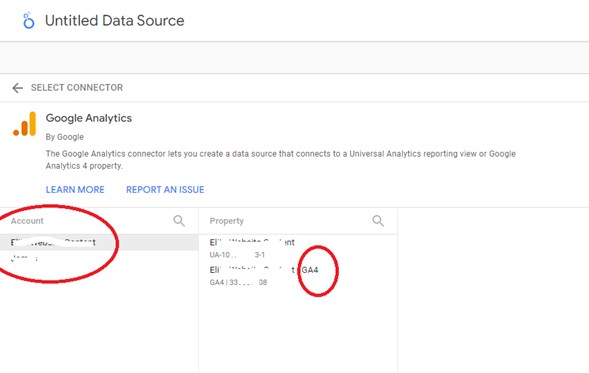
Click the “authorize” to connect to your existing Google Analytics account. If you have an account, it should be listed under the account column. Select G4A (Google Analytics 4 property) as shown below
Step 5: Connect and select data points to be included in your report
You should consider your GA4 account connected to Data Studio at this point. Proceed and choose the data sets you want and other dimensions like page views, bounce rate or abandonment rate, completion rate, etc., that you wish to see in your final report.
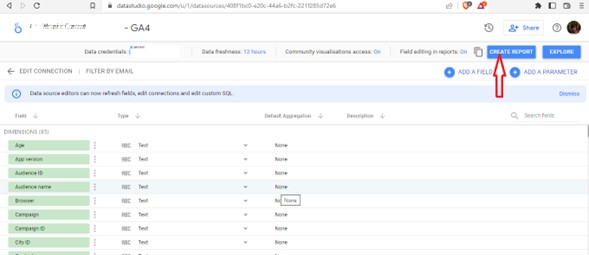
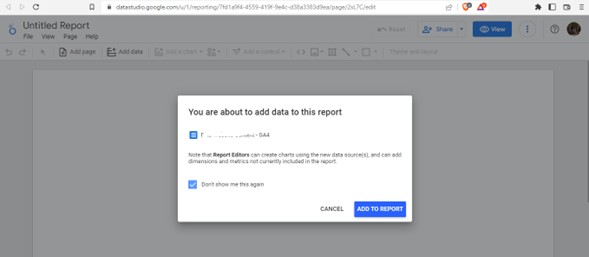
Step 6: Create a report
When you click on “create report” as shown in the above image, you will be directed to a page where you can add data to your report.
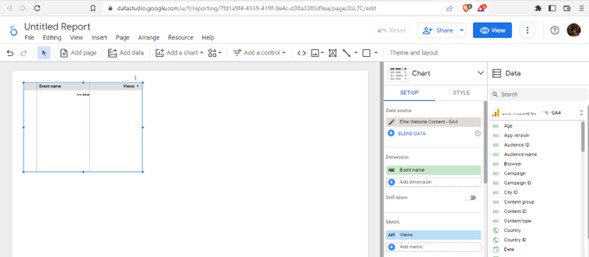
Google Data Studio has a user-friendly interface that allows you to add graphs, charts, tables, change font, colors, layout, data from various sources (including Google Ads), and more to your reports. It’s also possible to prepare and compare multiple reports.
GA4 reports
After step 6, you will have successfully linked GA4 and Data studio and created your report. It is possible to connect and export data to excel or PDF. GA4 reports made using Data Studio can also be shared via email or via a link.
Google Analytics dashboards
Another highly valuable tool when it comes to analyzing and processing your data is Google Analytics dashboards. These are dashboards (or widgets) that offer an overview of the metrics and reports you value the most. Google Analytics dashboards allow you to view multiple metrics instantaneously and be able to assess your account “health” and correlations between multiple reports. The dashboards can be created, customized, and shared.
It also offers updated information to website owners. GA dashboards will contain recent metrics as well as other information like real-time data and key performance indicators. The dashboards have analytical tools and stats critical for SEO (search engine optimization), overall website marketing, and other purposes.
Best Google Analytics dashboard and examples
There are several types of Google Analytics dashboards to consider, largely based on the specific metrics you want to track.
These are our top picks:
1. Web Analytics dashboard
GA Web Analytics Dashboard offers deep understanding and insights on website visitors such as their location, demographics (i.e., age), where they came from, the pages they visit on a website, session time (how long they spend on a website), conversion rates, checkout journey, devices used to visit a website, etc.
Example:
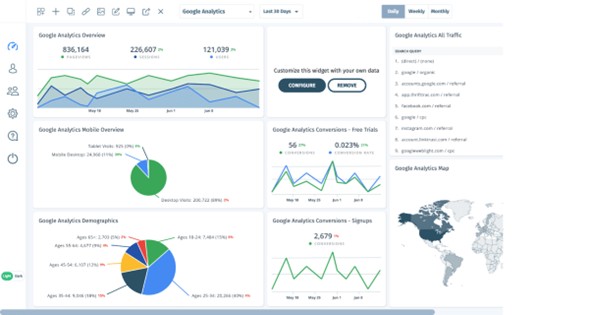
Source: Cyfe [1]
2. Google Analytics social media dashboard
As the name suggests, this dashboard allows you to track important social media metrics such as user engagement rates, visitors, most shared content, social media ads performance (i.e., clicks, cost per conversion, conversion rate, etc.), and more, depending on your focus.
Example:
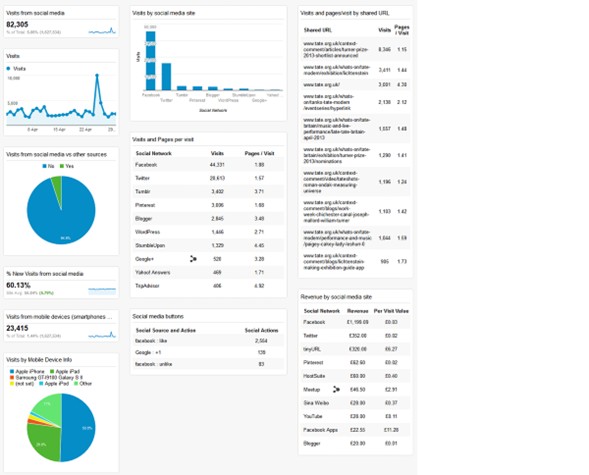
Source: Researchgate [2]
3. SEO performance dashboard
SEO is a critical part of online marketing. A search engine optimization performance dashboard will monitor all your SEO efforts and let you know where you should be focusing on. SEO metrics you can monitor include: top keywords, unique SEO visits, SEO traffic (from search engines like Google and Yahoo), backlinks, and more on blog posts and other website pages.
Example:
Source: Databox [3]
There are many more types of Google Analytics dashboards, such as executive dashboards (that have key business KPIs). When run correctly, these GA4 and Data Studio data analysis tools can be a real game changer for anyone in this industry. They have allowed us to have a deeper understanding of how our clients’ businesses are doing as well as the progress we have been making together. The different types of Google Analytics dashboards we have created along the way have also made the tracking of different but equally valuable metrics that much easier. The fact that we can even create our own dashboards from scratch, for a highly customized report, has maybe been our favorite feature so far, and the possibilities it has opened for our clients and us have been endless.
Conclusion
The benefits of linking GA4 and Data Studio must be abundantly clear right now, given just how many aspects they have that are specifically designed to make data analysis easier. Besides having superior data representation of your search/Google Analytics 4 data, you can import social media ad data to GA4 and get priceless insights into how your social media ads are performing. Linking GA4 and Data Studio also allow you to get up-to-date reports at all times as well as brand and share reports. You can also utilize Google’s very own analytics dashboards for visual data representation.
If this sounds like something you are interested in or, better yet, like exactly what you were looking for, then we hope of guide on how to link GA4 and Data Studio has been helpful, and that our tips for the best Google Analytics dashboards have posed a valuable plus for your marketing and data analysis efforts. We encourage you to give them all a try and let us know what you think. Now, we are not going to lie to you: figuring out how exactly to get the most out of all these features will take some time, but we assure you it will be worth it. However, if you are not able to dedicate the time this task requires, then let us give you a hand!
Here at Nomadic Advertising, we offer all our clients custom dashboards as part of our Google Ads and SEO services. With our help, you can know exactly how your Google ad campaigns and SEO efforts are performing through our detailed Google Analytics reports. We use Data Studio and other data visualization tools to ensure you can take advantage of Google data and track progress.
Follow our social media channels for more on Universal Analytics, digital analytics, Google Analytics 4, Data Studio, and related topics and services. If you are interested in knowing exactly how we can create a tailor-made strategy for your company, what our full Google Analytics and Google Ads service entails, and every other service at our disposal to help your online business thrive, you can book a FREE 30-minute consultation with us. Check out our website to find out more about us and see for yourself just how much we can do for you.
References
1) https://www.cyfe.com/
2) https://www.researchgate.net/figure/Google-Analytics-social-media-dashboard_fig81_337337065
3) https://app.databox.com/datawall/3bcb8dbd5204b55b6350f4c9f929a30b059702663